
The metaphor may be comical, but what we have collectively done to it so far surely is not. Just about four decades ago, in 1979, the arctic sea ice encompassed more than 7 mil sq. km. 40 years later the figure as well as the ice itself has shrunk down to just about 4.3 mil sq. km. This pretty much sums down to a declining rate of 12.8% per decade. If this is not alarming enough, perhaps the Before and After pictures might come in handy (NASA, 2020). Sea ice affects ocean circulation changing global climate. While this ice melts away, less sunlight will be reflected back to the atmosphere making the surface of the planet absorbing more solar energy, in extension raising the temperature. An increase that may seem small can lead to greater global warming (US National Ocean Service, 2020). Leave it to us humans that among the population of almost 7.8 billion people (Worldometers, 2020), 1.13 billion suffer from high blood pressure (World Health Organization, 2019) that we seem to transfer to our planet as well. Aren’t we a contagious lot!
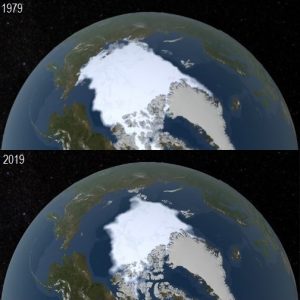
Original Images Courtesy: NASA
Carbon Dioxide levels in the air are peaking today in the last 650,000 years. In 2005, CO2 was recorded at 378 ppm (parts per million) which has come up to 414 ppm (NASA, 2020). About deforestation, according to World Bank, there has been a decrease of 1.3 million sq. km of forests between 1990 and 2015 (Khokhar & Tabary, 2016). NatGeo calculates 17% of reduction in all Amazonian rainforest in only the previous 50 years (Nunez, 2019). If Earth was a man of, losing 17% of hair in just one side would be worrisome, let alone the whole head. Moving on, NASA’s Goddard Institute for Space Studies, UK’s Met Office Hadley Center, US’ National Climate Data Center, Royal Meteorology Society’s publication by Cowtan and Way as well as Berkley Earth, all produced similar data about global temperature rise; our planet has a light fever (for now) of 1 degree Celsius that wasn’t there in the 1950s (Met Office Hadley Centre, 2020; Cowtan & Way, 2013; Berkeley Earth, 2020; NASA, 2020; National Oceanic and Atmospheric Administration, 2020). A human going from 98.6°F to 99.6°F (or 37°C to 37.5°C) would pop in a paracetamol and forget about it. This planet, on the other hand, had a one to two degree drop which caused the Little Ice Age. Some 20,000 years ago there was a decrease of 5 degrees and the planet suffered from Last Glacial Maximum covering much of Northern Europe, North America and Asia in ice sheets (Mithen, 2004; NASA, 2020).
Antarctica’s ice sheets are melting down at a rate of 147 gigatonnes per year, the rate the same in Greenland is 280 Gt/year (NASA, 2020). Considering 1993’s sea level to be zero, in 2020 it has gone up by 9.32 cm. The 3.3 mm/year rate may not seem a lot but according to research, the good case scenario is that the level will be 69cm more in 2100, the bad case scenario is that it’ll be 111cm. It is estimated to displace about 187 million people (Bamber, Oppenheimer, Kopp, Aspinall, & Cooke, 2019).
Fair enough! Most of us won’t live to see the day. How about 30 years from today? Hopefully a lot of us will be around by then. The level is calculated to be 34cm high in worst case scenario and 30cm considering we’re lucky. A research published in Nature claims the ‘moderate’ future scenario for 2050 to, and I quote, ‘threaten land currently home to a total of 150 million people’ (Kulp & Strauss, 2019). That’s a cold sweat transferring from the planet to its inhabitants. But is it really?
I remember The Matrix, ‘human beings are a disease, a cancer on this planet’. And notwithstanding the current pandemic that has befallen on all of us together, but are we really the ‘plague’ for this beautiful green-blue sphere circling around its sun for more than 4500 millenniums. Human beings (read homo sapiens) started to leave Africa and spread out on and around various regions from 125,000 years ago (Eurasia) and continued on until 40,000 years ago (Australia), 15,000 years ago (the Americans), etc., then how come most of the environmental indicators show sudden dip in the recent century and even the recent few decades, when our collective acumen seems to be the highest in the known history, most notably our era’s industrialization, technology, manufacturing as well as diplomacy. This much evolved global acumen exhibits the efforts we collectively are taking in order to fix what we have unknowingly broken; the Paris Agreement, Trillion Tree Campaign (Saul Elbein, 2019), emissions trading in an economically complicated world, are all appreciable steps that a specie wary of its habitat and concerned about its existence takes. It nevertheless raises the only and most important concern, are we on schedule?
On a Side Note: Birds never change their singsong, it may tell a lot about the speaker’s health, surroundings and more. However, the white-throated sparrows in Canada have started to sing a new one. Needless to mention, this phenomenon has never been observed before. Starting from British Columbia, the viral and trending ornithological song has spread 2000 miles away in Quebec, continuing further with more and more birds picking up the tune. Little does anyone know about the reason. But that’s a topic for another time. 😉
References
- Bamber, J. L., Oppenheimer, M., Kopp, R. E., Aspinall, W. P., & Cooke, R. M. (2019, June 4). Ice sheet contributions to future sea-level rise from structured expert judgment. Retrieved from UN National Library of Medicine, National Institute of Health: https://www.ncbi.nlm.nih.gov/pmc/articles/PMC6561295/
 #r38
#r38 - Berkeley Earth. (2020). Berkeley Earth. Retrieved from Berkeley Earth: http://berkeleyearth.org/
- Cowtan, K., & Way, R. G. (2013). Coverage bias in the HadCRUT4 temperature series and its impact on recent temperature trends. Retrieved from Royal Meteorology Society: https://rmets.onlinelibrary.wiley.com/doi/full/10.1002/qj.2297
- Khokhar, T., & Tabary, M. E. (2016, March 21). Five Forest Figures International Day Forests. Retrieved from World Bank Blog: https://blogs.worldbank.org/opendata/five-forest-figures-international-day-forests
- Kulp, S. A., & Strauss, B. H. (2019). New elevation data triple estimates of global vulnerability to sea-level rise and coastal flooding. Retrieved from Nature: https://www.nature.com/articles/s41467-019-12808-z
- Met Office Hadley Centre. (2020). Met Office Hadley Centre observations datasets. Retrieved from Met Office Hadley Centre: https://www.metoffice.gov.uk/hadobs/
- Mithen, S. J. (2004). After the Ice. Harvard University Press.
- NASA. (2020). Climate Center. Retrieved from NASA: https://climate.nasa.gov/vital-signs/arctic-sea-ice/
- NASA. (2020). Climate Center. Retrieved from NASA: https://climate.nasa.gov/vital-signs/carbon-dioxide/
- NASA. (2020). Climate Center. Retrieved from NASA: https://climate.nasa.gov/vital-signs/ice-sheets/
- NASA. (2020). NASA Earth Observatory. Retrieved from NASA: https://earthobservatory.nasa.gov/world-of-change/global-temperatures#:~:text=According%20to%20an%20ongoing%20temperature,2%C2%B0%20Fahrenheit)%20since%201880.
- National Oceanic and Atmospheric Administration. (2020). Assessing the Global Climate in 2019. Retrieved from NOAA: https://www.ncei.noaa.gov/news/global-climate-201912
- Nunez, C. (2019, February 7). Climate 101: Deforestation. Retrieved from National Geographic: https://www.nationalgeographic.com/environment/global-warming/deforestation/
- Saul Elbein. (2019, April 26). Reforestation. Retrieved from National Geographic: https://www.nationalgeographic.com/environment/2019/04/how-to-regrow-forest-right-way-minimize-fire-water-use/
- US National Ocean Service. (2020). How does sea ice affect global climate? Retrieved from Noaa.gov: https://oceanservice.noaa.gov/facts/sea-ice-climate.html
- World Health Organization. (2019, September 13). Hypertension. Retrieved from World Health Organization: https://www.who.int/news-room/fact-sheets/detail/hypertension#:~:text=An%20estimated%201.13%20billion%20people,cause%20of%20premature%20death%20worldwide.
- Worldometers. (2020, July 6). Current World Population. Retrieved from Worldometers.info: https://www.worldometers.info/world-population/